Performance§
Everything on this page was measured on GCP against Cloud SQL for PostgreSQL. The provisioning script and the benchmark ship in the repository, so you can reproduce every figure.
The ceiling of one node§
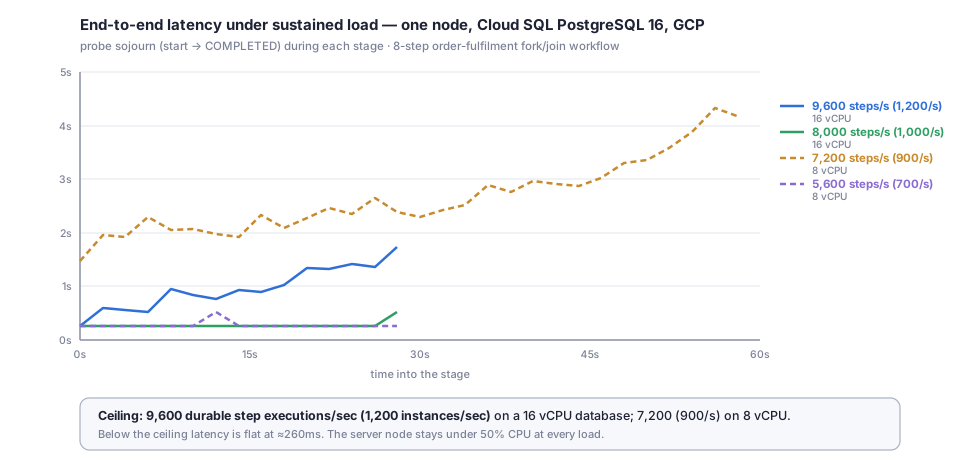
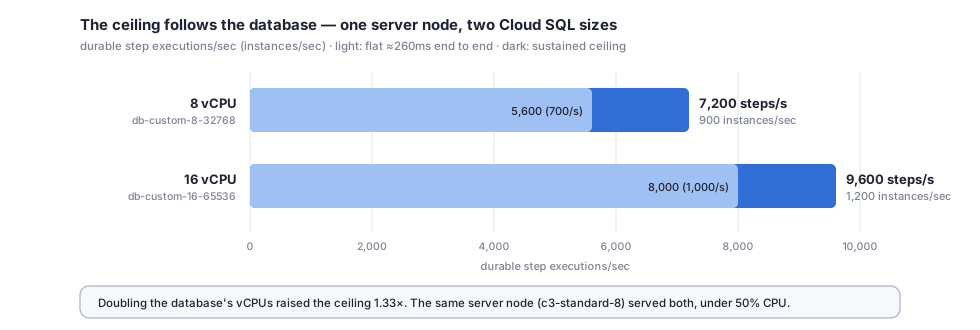
9,600 durable step executions/sec (1,200 workflow instances/sec), sustained by one server node. Every step is committed to PostgreSQL, and each instance completes in about 1 to 1.5 seconds end to end. At lighter load the end-to-end time is about 260ms: 8,000 steps/sec (1,000 instances/sec) holds flat with no backlog.
Each instance is the 8-step order-fulfilment fork/join workflow: validate, a stock gate, two
parallel branches, an explicit combine, notify and audit. It runs in LOCAL_ASYNC mode. The bench
ramps the offered start rate and measures probe sojourn: the time a fresh instance takes from
start() to COMPLETED. The ceiling is the highest load at which sojourn stays bounded.
| Cloud SQL | sustained load | window | end-to-end latency |
|---|---|---|---|
| 8 vCPU | 5,600 steps/s (700/s) | 30s | flat ≈260ms |
| 8 vCPU | 7,200 steps/s (900/s), the ceiling | 2 × 60s | ≈2–4s |
| 16 vCPU | 7,200 steps/s (900/s) | 2 × 60s | flat ≈260ms |
| 16 vCPU | 8,000 steps/s (1,000/s) | 30s | flat ≈260ms |
| 16 vCPU | 9,600 steps/s (1,200/s), the ceiling | 30s | ≈0.9–1.4s |
What sets the ceiling§
The database sets the ceiling, not the server. At the ceiling the server node stayed under 50% CPU and the workers had headroom. On 8 vCPU, Cloud SQL ran at ≈80% CPU. On 16 vCPU it peaked at only 63%: there the limit is time spent waiting on instance locks, because the two branches of a fork finish together and the second one's report waits for the first one's commit. Doubling the database's vCPUs raised the ceiling 1.33×. Adding server nodes on the same database would not raise it.
Size the connection pool to the load. With WIGGLE_JDBC_POOL_SIZE=32 (the default is 10),
starts queued for a connection at ≈561/s while the server and database CPUs still had headroom.
One instance makes ≈45 SQL statements, so at 600/s about 25 connections are busy at once.
Raising the pool to 128 removed the limit.
Environment§
| Region | GCP us-central1-a. Everything is in one zone, on a private VPC. |
| Database | Cloud SQL Enterprise, PostgreSQL 16, zonal (no HA standby), 250 GB SSD, db-custom-8-32768 and db-custom-16-65536 |
| Server | 1 node, c3-standard-8, WIGGLE_JDBC_POOL_SIZE=128, default settings otherwise |
| Workers | own c3-standard-8: 4 processes × 256 slots, LOCAL_ASYNC batch 64 |
| Load generator | own c3-standard-8: RateCeilingBench, 256 submitter threads |
| Build | revision 0dcff87, OpenJDK 21; one database, resized from 8 to 16 vCPU between runs |
A regional (HA) Cloud SQL instance adds a synchronous standby to every commit, so expect a lower ceiling there.
Reproduce it§
The script provisions the environment, deploys a revision, runs the ladder, and collects
pg_stat_statements, per-VM CPU and a server JFR:
export GCP_PROJECT=<sandbox-project>
deploy/gcp/ceiling.sh up && deploy/gcp/ceiling.sh deploy && deploy/gcp/ceiling.sh run
deploy/gcp/ceiling.sh down
See deploy/gcp/README.md for every knob.